
Quarterly Activities Report for Period Ended 30 June 2026
QUEBEC CITY, July 30, 2026 (GLOBE NEWSWIRE) -- Predictive Discovery Limited (ASX:PDI, TSX:PDI) (“PDI” or the “Company”) is pleased to announce its Quarterly Activities Report for the three-month period ended 30 June 2026. The June quarter was a period of continued delivery across the Company, with a strong focus on operational performance at Kiniéro and Nampala gold mines, advancing key development activities at Bankan and maintaining momentum across the broader portfolio.
HIGHLIGHTS1
- The Group delivered strong operational performance during the quarter, pouring a total of 64,026oz Au.
- Kiniéro had average plant throughput of ~9.0Mtpa during the quarter, 50% above nameplate capacity, while gold recovery improved to 90.5% and 54,252oz Au was poured.
- Nampala provided a solid contribution, pouring a further 9,774oz Au.
- Gold sales increased 17% to 48,924oz Au, reflecting strong production and sales performance during the quarter, offset by timing of gold shipments around the end of the quarter at Kiniéro.
- All-in sustaining cost (“AISC”) of US$1,408/oz across both operations, with Kiniéro delivering strong cost performance at US$1,254/oz and Nampala at US$1,974/oz.
- Cash margin from operations of US$112M, reflecting strong cash generation at both the Kiniéro and Nampala gold mines.
- PDI remains on track to achieve 2026 production guidance of 198,000-220,000oz Au.
- 2026 AISC guidance set at US$1,300-1,500/oz, comprising US$1,100-1,300/oz at Kiniéro and US$2,000-2,200 /oz at Nampala.
- Bankan execution readiness advanced with process plant FEED completed, detailed design commencing in July 2026 and key contracts awarded for the power station, grinding circuit and TSF.
- US$13.8M in capital gains taxes and duties agreed with the Government of Guinea in connection with the merger of PDI and Robex Resources Inc (“Robex”).
- As at 30 June 2026, PDI held US$364.3M of cash and bullion.2
SUMMARY OPERATIONAL AND FINANCIAL METRICS
Operational Mines
| Units | Jun-26 Quarter | Mar-26 Quarter | Var % | YTD FY26 | ||
| Gold Poured | oz | 64,026 | 48,178 | 33% | 112,204 | |
| Gold Sales | oz | 48,924 | 41,799 | 17% | 90,723 | |
| Realised Price | US$/oz | 4,441 | 4,806 | (8%) | 4,609 | |
| Revenue | US$M | 217.3 | 200.8 | 8% | 418.1 | |
| Royalties | US$M | 17.8 | 16.8 | 6% | 34.6 | |
| AISC | US$/oz | 1,408 | 1,192 | 18% | 1,308 | |
| Cash and Bullion | US$M | 364.3 | 277.2 | 31% | 364.3 | |
- Gold poured increased to 64,026oz, up 33% from 48,178oz in the March 2026 quarter, driven by Kiniéro production. This reflects the operation's continued strong performance as it transitioned to steady-state production levels combined with continued steady output from Nampala.
- Gold sales totalled 48,924oz, an increase of 17% compared to 41,799oz in the March 2026 quarter, driven by higher production volumes in Kiniéro, partially offset by the timing of bullion shipments around the end of the quarter (see Guinea refining update below). Subsequent to quarter-end, the Company has shipped approximately 33,838oz, generating provisional receipts of approximately US$135.7M.
- Realised price of US$4,441/oz, down 8% from US$4,806/oz in the March 2026 quarter, driven by lower prevailing gold spot prices.
- Revenue from operations increased to US$217.3M, up 8% from US$200.8M in the March 2026 quarter, driven by higher gold production and sales volumes.
- AISC increased to US$1,408/oz across both operations, up 18% from US$1,192/oz in the March 2026 quarter, primarily reflecting higher sustaining capital expenditure and elevated stripping activities at Nampala, together with the normalisation of mining costs at Kiniéro following the processing of pre-mining ROM stockpiles during the March 2026 quarter.
-
Cash and bullion: Cash and bullion holdings increased to US$364.3M, comprising US$273.9M in cash and 22,444oz Au bullion on hand, reflecting strong cash generation and increased bullion holdings during the quarter.3
OPERATIONS AND PROJECTS
Kiniéro Gold Mine, Guinea
| Units | Jun-26 Quarter | Mar-26 Quarter | Var % | YTD FY26 | ||
| Financial Summary | ||||||
| Gold Poured | oz | 54,252 | 38,178 | 42% | 92,430 | |
| Gold Sales | oz | 38,470 | 32,306 | 19% | 70,777 | |
| Realised Price | US$/oz | 4,432 | 4,808 | (8%) | 4,602 | |
| Revenue | US$M | 170.5 | 155.2 | 10% | 325.7 | |
| Royalties | US$M | 10.7 | 9.8 | 9% | 20.4 | |
| AISC | US$/oz | 1,254 | 1,043 | 13% | 1,158 | |
| Production Summary | ||||||
| Ore Mined | dmt | 2,164,144 | 2,137,273 | 1% | 4,301,417 | |
| Total Material Mined | dmt | 4,415,485 | 5,105,131 | (14%) | 9,520,616 | |
| Stripping Ratio | t:t | 1.0 | 1.4 | (25%) | 1.2 | |
| Processed Ore | dmt | 2,218,503 | 1,607,851 | 38% | 3,826,354 | |
| Head Grade | g/t | 0.86 | 0.87 | (2%) | 0.86 | |
| Recovery | % | 90.5 | 90.1 | 0% | 90.4 | |
- Total material mined decreased to 4,415,485 tonnes, down 14% from 5,105,131 tonnes in March quarter. This included 2,164,144 tonnes of ore mined, up 1% quarter-on-quarter, with the balance comprising waste material. The reduction reflects lower waste movement and a decrease in stripping ratio from 1.4 to 1.0, while ore mining remained stable during the quarter.
- Ore processed: A total of 2,218,503 tonnes of ore were processed during the quarter, up 38% from 1,607,851 tonnes in the March 2026 quarter. The processing plant continued to operate well, with ongoing optimisation activities supporting improved plant performance and enabling throughput rates well above nameplate.
- Average head grade was 0.86g/t, down 2% from 0.87g/t in the March 2026 quarter. The lower head grade reflects the processing of a broader ore blend sourced from different areas of the orebody in line with the planned mining sequence.
- Gold recovery increased to 90.5%, compared with 90.1% in the March 2026 quarter. The improvement reflects strong metallurgical performance, supported by stable plant operations and optimisation of processing circuits, which contributed to higher overall recovery during the quarter.
-
AISC: increased to US$1,254/oz from US$1,043/oz in the March 2026 quarter. The March quarter benefited from ore stockpiled on the ROM pad prior to the commencement of mining, resulting in a lower allocation of mining costs to ounces produced. As mining activities normalised during the June quarter, a full quarter of mining costs was reflected in production. Kiniéro continued to deliver strong cost performance while operating at approximately 9.0Mtpa, well above nameplate capacity.
Nampala Gold Mine, Mali
| Units | Jun-26 Quarter | Mar-26 Quarter | Var % | YTD FY26 | ||
| Financial Summary | ||||||
| Gold Poured | oz | 9,774 | 10,000 | (2%) | 19,774 | |
| Gold Sales | oz | 10,454 | 9,493 | 10% | 19,947 | |
| Realised Price | US$/oz | 4,447 | 4,800 | (7%) | 4,631 | |
| Revenue | US$M | 46.8 | 45.6 | 3% | 92.4 | |
| Royalties | US$M | 7.2 | 7.1 | 2% | 14.3 | |
| AISC | US$/oz | 1,974 | 1,699 | 16% | 1,843 | |
| Production Summary | ||||||
| Ore Mined | dmt | 454,188 | 658,907 | (31%) | 1,113,095 | |
| Total Material Mined | dmt | 2,429,436 | 2,808,365 | (13%) | 5,237,801 | |
| Stripping Ratio | t:t | 4.4 | 3.3 | 33% | 3.71 | |
| Processed Ore | dmt | 494,163 | 504,354 | (2%) | 998,517 | |
| Head Grade | g/t | 0.71 | 0.71 | 0% | 0.71 | |
| Recovery | % | 86.5 | 86.4 | 0% | 86.4 | |
- Total material mined: decreased to 2,429,436 tonnes, down 13% from 2,808,365 tonnes in the March 2026 quarter. Ore mined totalled 454,188 tonnes, down 31% quarter-on-quarter, while the stripping ratio increased to 4.4. Mining activities during the quarter continued to focus on waste movement to support access to ore zones.
- Total ore processed: 494,163 tonnes, representing a 2% decrease from 504,354 tonnes in the March 2026 quarter. Despite the lower throughput, the Nampala mine continued to deliver strong operational performance, with the processing plant operating reliably and maintaining stable operating conditions throughout the quarter.
- Average head grade was 0.71g/t, consistent with the March 2026 quarter. The stable head grade reflects the processing of ore from the planned mine sequence, with a consistent ore feed profile maintained throughout the quarter.
- Gold recovery: for the June 2026 quarter improved to 86.5%, from 86.4% in the March 2026 quarter. The result reflects stable plant operations and consistent metallurgical performance during the period.
-
AISC increased to US$1,974/oz from US$1,699/oz in the March 2026 quarter, primarily due to higher sustaining capital expenditure and increased stripping activity, with the stripping ratio rising to 4.4 as waste movement was prioritised to support future mining areas.
Bankan Gold Project, Guinea
Bankan is one of West Africa's largest undeveloped gold projects and is expected to provide the foundation for the Company's next phase of production growth alongside Kiniéro.
Development and optimisation activities advanced significantly during the quarter, with engineering, procurement and contracting workstreams progressing in preparation for commencement of project execution following the grant of the Exploitation Permit and a subsequent Final Investment Decision.
Front-end engineering design (“FEED”) for the process plant was completed during the quarter, with the process design criteria and process flowsheets finalised and the process plant layout substantially completed. The scope for detailed design has been finalised and detailed design activities commenced in July 2026. Electrical and instrumentation engineering for the process plant and power station was also awarded to ECG Engineering.
Procurement activities progressed significantly, with 23 long-lead mechanical equipment packages issued for tender and eight packages progressing through technical and commercial evaluation, with purchase orders issued to enable vendor data to support detailed design. Major equipment procurement advanced with the award of the 40MW power station contract to Hyundai Heavy Industries and the SAG and ball mill supply contract to NCP International. The tailings storage facility (“TSF”) design contract was also awarded to Knight Piésold, with design activities commencing during the quarter.
Engineering and layout development continued across the process plant, with bulk earthworks design progressing following completion of the LIDAR survey. Structural, mechanical and piping design activities advanced, while tenders for structural steel, platework fabrication and concrete works were prepared for issue. The development team also continued to progress procurement and contracting activities for key project packages, with further equipment orders to be placed following receipt of the required permit.
Environmental and social workstreams continued to progress in support of future project development, in parallel with the advancing of technical and execution readiness.
PDI is developing a detailed implementation schedule and revised overall capital cost estimate, which are planned to be completed in the second half of 2026 following completion of the process plant FEED, mine plan evaluation and the first phase of the TSF design. Based on current information, the Company does not anticipate any increase to the US$463M capital cost reported in the Definitive Feasibility Study and is pursuing initiatives to reduce the upfront capital cost.
GUINEA UPDATE
Guinea Gold Refining Update
On 21 June 2026, President Mamadi Doumbouya convened a meeting with industrial, semi-industrial and artisanal gold producers operating in Guinea, at which he indicated the Government's intention to require all gold produced in Guinea to be refined domestically prior to export.
On 8 July 2026, the Government of Guinea issued a decree mandating the local refining of gold produced in the country. The decree introduced a 90-day transitional period expiring on 6 October 2026, after which the export of gold that has not been refined in Guinea to a minimum purity of 95.5% will be prohibited. Following the expiry of the transitional period, only gold refined to the required purity by an authorised Guinean refinery and certified for export will be permitted to leave the country.
The Government has indicated that the Nimba Gold Refinery, located in Conakry, is expected to play a central role in supporting implementation of the new domestic refining framework.
Under the decree, industrial mining companies remain responsible for arranging and executing the export and sale of their own gold, subject to compliance with the applicable refining, certification and export requirements.
Following the meeting on 21 June 2026, gold exports were temporarily paused while the Government finalised the regulatory framework and implementation requirements for in-country refining. Since 8 July 2026, PDI has shipped approximately 33.8koz of gold under existing export agreements, generating provisional receipts of approximately US$135.7M. The Company continues to produce, export and sell gold in the ordinary course of business and has not experienced any material interruption to mining or processing operations.
The Company is working constructively with the relevant Guinean authorities, the Chamber of Mines and other Guinean gold producers to support a practical and orderly transition to the new regime. In parallel, PDI is also investigating potential development of its own refining operations on-site to achieve the prescribed purity threshold prior to export.
PDI does not expect the decree to have a material impact on the Company or its 2026 production guidance.
Capital Gains Tax
After the quarter end during July, the Company agreed to pay US$13.8M in capital gains taxes and duties assessed by the Government of Guinea related to the merger between PDI and Robex.
As part of the settlement, PDI received confirmation from the relevant authorities that no further capital gains tax, registration duties or other fiscal claims will arise in Guinea in connection with the merger or related post-merger reorganisation activities. The settlement provides fiscal certainty in relation to the transaction and resolves all known tax and duty matters arising from the merger in Guinea.
HEALTH AND SAFETY
PDI recorded zero recordable injuries during the June 2026 quarter, with its rolling 12-month Total Recordable Injury Frequency Rate (“TRIFR”) improving to 1.8 as at 30 June 2026, compared with 2.3 as at 31 March 2026.
During the quarter, Kiniéro operations surpassed 7.4 million hours without a Lost Time Injury (“LTI”), while Nampala surpassed 2.1 million hours since its last LTI was recorded in November 2025.
PDI continues to focus on critical risk management, safe access and egress, and strengthening controls around maintenance and manual handling activities to support ongoing improvements in safety performance.
2026 GUIDANCE
PDI announced 2026 production guidance of 198,000-220,000oz in the March 2026 quarterly activities report, and remains on track to achieve guidance.
Following Kiniéro ramp up, PDI has now established 2026 AISC guidance for the Company and its gold operations, providing increased transparency on PDI’s anticipated cost structure alongside its gold production profile as it transitions to a multi-asset producer.
The guidance reflects the expected operating profile of both operations and incorporates management’s current assumptions regarding operating performance and cost inputs.
Management remains focused on disciplined cost management, operational optimisation and delivering sustainable improvement across both operations. The Company will continue to monitor operating performance, cost inputs and market conditions throughout the remainder of 2026 and will provide updates to the market where appropriate.
| Guidance4 | Units | Group | Kiniéro | Nampala |
| Gold Poured | oz | 198,000 – 220,000 | 157,000 – 174,000 | 41,000 – 46,000 |
| AISC | US$/oz | 1,300 – 1,500 | 1,100 – 1,300 | 2,000 – 2,200 |
EXPLORATION AND GEOLOGY
Exploration activities focused on resource growth, geological modelling and near-mine target generation across the Company’s operating assets in West Africa. Exploration programs were primarily directed at opportunities to expand existing Mineral Resources and identify additional ore sources capable of supporting long-term production growth at both the Kiniéro and Nampala operations.
Kiniéro
Located within the prolific Siguiri Basin, the Kiniéro licence area hosts multiple structurally-controlled gold deposits within Birimian greenstone sequences. The exploration strategy at Kiniéro is to prioritise near-mine targets and extensions to known mineralised zones that may support future mine life extensions and operational flexibility, and identify opportunities to expand Mineral Resources within the broader permit area. Work included geological interpretation, data validation and targeted drilling to refine the structural controls on mineralisation and support ongoing mine planning.
The quarter was characterised by an increase in diamond (“DD”) and reverse circulation (“RC”) drilling activities principally around near-mine prospects.
For the quarter a total of 11,553 meters was drilled (comprising 9,388 meters of DD and 2,165 meters of RC drilling). Year-to-date, a total of 17,890 meters (16,210 meters of DD and 1,680 meters of RC drilling) has been achieved. Additional DD and RC drilling capacity is expected to materially increase monthly drilling output from mid-July onwards (particularly for RC drilling).
The 2026 exploration strategy aims to continue developing near-mine oxide resources, improve orebody knowledge, define a JORC-compliant maiden inferred hard rock resource and exploration targets at Kiniéro.
Nampala
The Nampala deposits are hosted within the Birimian greenstone belt of southern Mali and comprise structurally-controlled gold mineralisation associated with altered volcanic and sedimentary sequences. Exploration work during the period included geological interpretation and drilling aimed at supporting potential Mineral Resource growth, extending the life of the current open pit operation, and testing additional targets within the permit area.
The exploration activities carried out at Nampala for the quarter remained focused on testing the continuity of fresh rock mineralisation under the existing pits. Current programmes continue improving geological understanding and supporting future reserve growth. For the quarter a total of 4,277 meters was drilled (comprising 1,008 meters of DD and 3,269 meters of RC drilling). Year-to-date, a total of 9,455m (2,096 meters of DD and 7,359 meters of RC drilling) has been achieved. As with Kiniéro, the 2026 exploration strategy aims to continue developing near-mine oxide resources, improve orebody knowledge, define a JORC-compliant maiden inferred hard rock resource and develop exploration targets.
Bankan
Bankan, also located within Guinea’s Siguiri Basin, hosts the large-scale NEB open pit and underground deposits, and the BC and Gbengbeden satellite deposits. Mineralisation is structurally controlled and associated with shear zone-hosted lodes, occurring within quartz veins and quartz-veined fracture zones. The NEB deposit is open at depth and there is potential to discover additional deposits on PDI’s permits. Planning for further exploration is progressing and will be initiated once an Exploitation Permit is issued.
Exploration activities for the quarter comprised ongoing strategic planning, scheduling and budgeting of 2026 work programmes aimed at improving orebody knowledge, resource development and exploration upside opportunities, no drilling activities occurred for the quarter.
CORPORATE
Financial Position
As at 30 June 2026, PDI held US$364.3M of cash and bullion, comprising US$273.9M of cash on hand and 22,444oz of gold bullion.
Debt outstanding was US$130M, reflecting the fully drawn Sprott senior secured facility used to fund the development of the Kiniéro Gold Mine. The Company continued to generate strong operating cash flows during the quarter, partially offset by one-off costs associated with the merger with Robex and the completion of the Kiniéro royalty buyback programme, which is expected to be accretive to future cash flows.
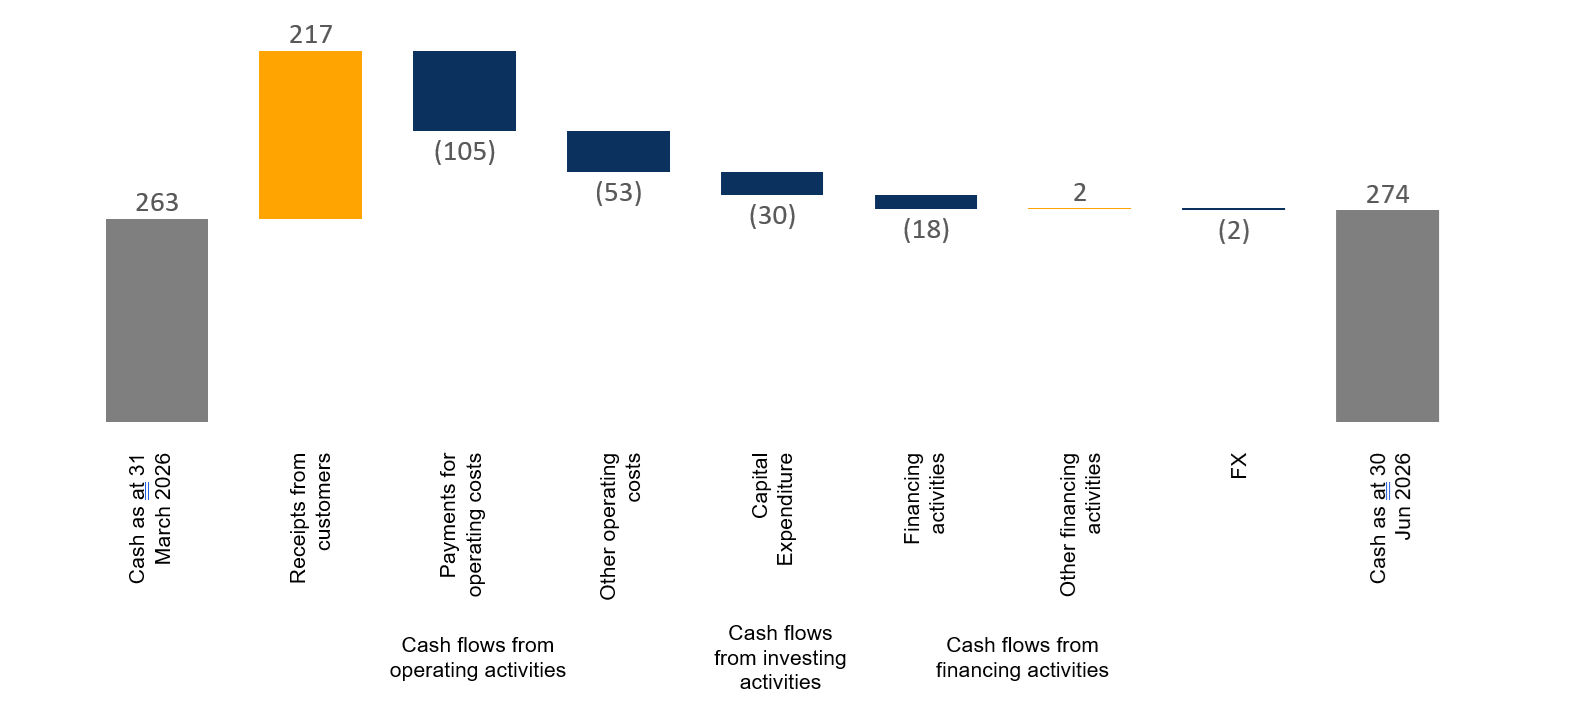
Cash margin from operations totalled US$112M, calculated as receipts from customers of US$217M less operating costs of US$105M. The result reflects strong cash generation from both the Kiniéro and Nampala operations, supported by the continued ramp-up and strong operational performance at Kiniéro.
Other operating costs totalled US$53M including US$36M of merger-related costs, US$9M associated with the private royalty buyback over Kiniero (0.5% net smelter royalty) completed during the quarter and US$6M of tax payments at Nampala. The private royalty buybacks are expected to provide a long-term benefit to the Company by eliminating future NSR royalty payments over the life of the relevant operations and supporting future cash flow generation.
Total capital expenditure during the quarter was approximately US$30M, comprising US$26M invested in mine development, infrastructure and project activities across Bankan, Kiniéro and Nampala, with a further US$4M invested in exploration and evaluation activities.
Financing activities of US$18M included interest payments and gold price participation payments under the Company's Sprott senior secured facility. Other financing activities (interest on restricted cash) contributed US$2.0M, while foreign exchange movements reduced cash balances by approximately US$2.0M during the quarter.
The Company continues to maintain a disciplined approach to capital allocation while prioritising operational performance, strong cash generation and advancement of the Bankan Gold Project. The strength of the balance sheet and cash flow generation from Kiniéro and Nampala provide a solid platform to support the Company's future growth initiatives.
Figure 1: Quarterly Cash Flow Waterfall (US$M)5
Other Corporate Activities
- Robex-PDI Merger Completion (15 April 2026): Completed the merger with Robex by way of a statutory plan of arrangement, creating a leading West African gold producer and developer with a portfolio comprising the Kiniéro and Nampala operating mines and the Tier-1 Bankan development project. The transaction established a dual ASX and TSX-listed company with enhanced scale, cash flow generation and growth opportunities.
- Change of Financial Year (4 May 2026): The Company's financial year-end changed from 30 June to 31 December to better align financial reporting and audit requirements with its West African operations and reporting obligations.
- Change of Auditor (24 June 2026): Appointed Grant Thornton Audit Pty Ltd (Robex auditor) as external auditor following the resignation of PKF Perth, supporting the governance and reporting requirements of the enlarged dual-listed group.
- Strategic Investment in Awalé Resources (15 July 2026): Announced a US$10 million strategic investment in Awalé Resources Limited, securing an approximately 11.8% interest and providing exposure to the highly prospective Odienné gold-copper district in Côte d'Ivoire.
- Proposed Name Change (21 July 2026): Announced a proposal to change the Company's name to “PDI Gold Limited”, subject to shareholder approval, reflecting its transition to a multi-asset West African gold producer and developer.
-
Proposed Capital Consolidation (21 July 2026): Announced a proposed 5-for-1 consolidation of the Company's issued capital, subject to shareholder approval, to establish a more appropriate capital structure and share price profile for the enlarged group.
Expenditure on Mining Exploration Activities
In accordance with ASX Listing Rule 5.3.1, PDI's exploration and evaluation expenditure during the quarter was A$5.97M (US$4.04M), as set out in item 2.1(d) of the Appendix 5B. Expenditure primarily related to drilling contractors, materials and exploration personnel.
Operational and development activities for the Kiniéro and Nampala operations, and advancement of the Bankan Gold Project, are discussed elsewhere in this Quarterly Activities Report.
Payments to Related Parties and their Associates
In accordance with ASX Listing Rule 5.3.5, payments to related parties of the Company and their associates during the quarter was approximately A$1.49M including GST. The Company advises that this relates to Directors’ fees and termination payments of directors.
Capital Structure
As at the date of this Quarterly Activities Report, PDI has 4,940,077,185 fully paid ordinary shares on issue.
This announcement is authorised for release by the PDI Board of Directors.
Neither the Toronto Stock Exchange nor its Regulation Services Provider (as that term is defined in the policies of the Toronto Stock Exchange) accepts responsibility for the adequacy or accuracy of this release.
For further information visit our website at www.predictivediscovery.com or contact:
|
Investor Enquiries Matthew Wilcox CEO & Managing Director E:info@predictivediscovery.com P: +61 8 9216 1000 |
Media Enquiries Nathan Ryan NWR Communications E:nathan.ryan@nwrcommunications.com.au P: +61 420 582 887 |
ABOUT PREDICTIVE DISCOVERY
PDI is a leading West African gold production and development company, combining a portfolio of high quality assets with a proven execution capability and strong financial platform.
PDI’s asset portfolio is anchored by the Kiniéro Gold Mine in Guinea, which commenced production in late 2025, and the Nampala Gold Mine in Mali, which has been operating since 2017. These production assets provide momentum and strong cash flows as the Company advances its growth plans.
PDI’s long-life growth asset is the Tier-1 Bankan Gold Project in Guinea, one of the largest undeveloped gold projects in Africa. Bankan is approaching construction-ready status with expected production of ~250,000oz per annum over more than 12 years.
Once Bankan is in production, PDI is targeting annual production exceeding 400,000oz by 2029 from its low-cost mining hub in Guinea, leveraging the proximity and synergies of the Kiniéro and Bankan assets.
PDI is at a pivotal stage in its evolution, growing into a mid-tier, multi-mine West African gold producer, with a clear focus on sustainably developing its portfolio to create long-term value for shareholders and stakeholders.
COMPLIANCE STATEMENTS
Not an Offer
This announcement does not constitute an offer to sell or the solicitation of an offer to buy any securities. No securities regulatory authority has approved or disapproved the contents of this announcement. The securities referred to in this announcement have not been, and will not be, registered under the U.S. Securities Act of 1933, as amended, and may not be offered or sold in the United States, or to, or for the account or benefit of, U.S. persons, except pursuant to an exemption from, or in a transaction not subject to, U.S. registration requirements.
Forward-Looking Statements
This announcement contains forward-looking statements and forward-looking information within the meaning of applicable securities laws. Forward-looking statements include, but are not limited to, statements regarding gold production and guidance, expectations regarding exploration and development activities and potential, expectations regarding permitting and development funding for the Bankan Project. Forward-looking statements are based on assumptions and expectations as at the date of this announcement and are subject to known and unknown risks and uncertainties that may cause actual results to differ materially. Forward-looking statements are generally identified by words such as “will”, “expect”, “anticipate”, “may”, “could”, “should”, “plan”, “estimate” and similar expressions.
Although PDI believes that the expectations reflected in the forward-looking statements are reasonable, undue reliance should not be placed on forward-looking statements since no assurance can be provided that such expectations will prove to be correct. Forward-looking statements are based on information available at the time those statements are made and/or good faith belief of the officers and directors of PDI as of that time with respect to future events and are subject to risks and uncertainties that could cause actual results to differ materially from those expressed in or suggested by the forward-looking statements. Forward-looking statements involve numerous risks and uncertainties. Factors that could cause actual results to differ materially include, but are not limited to, commodity price fluctuations, foreign exchange movements and general economic conditions, geopolitical, social and regulatory risks, operating and cost risks, the speculative nature of exploration and project development including the risks of obtaining necessary approvals, licenses, permits and funding, diminishing quantities or grades of reserves, changes to the legal and regulatory framework within which PDI operates or may in the future operate, environmental conditions including extreme weather conditions, recruitment and retention of personnel, industrial relations issues and litigation and other risks described in PDI’s public disclosure documents filed on ASX and on SEDAR+.
Forward-looking statements speak only as of the date they are made. Except as required by applicable law, PDI undertakes no obligation to update or revise any forward-looking statements contained in this announcement. All forward-looking statements contained in this announcement are expressly qualified in its entirety by the above cautionary statement.
Production Targets
This announcement refers to PDI having expected production of 400,000oz per annum by 2029. The production targets in respect of the Bankan Project were released to ASX on 25 June 2025 in an announcement by PDI titled “Bankan DFS Confirms Outstanding Project Economics”. The production targets in respect of Robex’s Kiniéro Project were released to ASX on 22 August 2025 in an announcement by Robex titled “Amendment to Kiniéro Gold Project Technical Report”. PDI confirms that all the material assumptions underpinning the production targets in the previous announcements continue to apply and have not materially changed.
TENEMENT SCHEDULE AS AT 30 JUNE 2026
Kiniéro Exploitation Permit Details (Guinea)
| Permit No | Type | Mineral | Area (Km2) | Deposit | Current Holding Company |
| 311 | Exploitation Permit | Gold | 95.51 | SMG | |
| 310 | Exploitation Permit | Gold | 37.85 | SMG | |
| 271 | Exploitation Permit | Gold | 99.35 | SMG | |
| 312 | Exploitation Permit | Gold | 93.63 | Sabali North and Central, Sabali South, SGA, Jean and Banfare | SMG |
Mansounia Exploration Permit Details (Guinea)
| Permit No | Type | Mineral | Area (Km2) | Deposit | Current Holding Company |
| 1048 | Exploration Permit | Gold | 53.78 | Mansounia | Penta Goldfields |
| 1049 | Exploration Permit | Gold | 90.37 | Mansounia | Penta Goldfields |
Bankan Exploration Permit Details (Guinea)
| Permit No | Type | Mineral | Area (Km2) | Deposit | Current Holding Company |
| 5784 (Kaninko) | Exploration Permit | Gold | 98.22 | NEB, BC | Hamana Gold |
| 1835 (Saman) | Exploration Permit | Gold | 99.78 | NEB | Hamana Gold |
Nampala Exploitation Permit Details (South Mali)
| Permit No | Permit Name | Start Date | Expiry Date | Area | Status |
| PE 2011/17 | Nampala Exploitation Permit | 21 March 2012 | 21 March 2042 | 16km2 | Active |
Nampala Exploration Permit Details (South Mali)
| Permit No | Permit Name | Start Date | Area | Status |
| PR: 17/868 | Kamasso | 19 September 2017 | 100km2 | Under renewal process |
| PR: 16/802 Bis 1 | Diangounte | 28 November 2017 | 52km2 | Under renewal process |
| PR: 19/1038 | Sanoula | 28 August 2019 | 31.5km2 | Under renewal process |
| PR: 19/1039 | Mininko | 17 September 2019 | 46.20km2 | Under renewal process |
| PR: 20/1088 | Gladie | 31 March 2021 | 52km2 | Under renewal process |
PDI Other Permit Details
| Name | Number | Location | Area (Km2) | PDI equity |
| Bocanda North | Mining exploration permit application | Cote D'Ivoire | 368 | 20% (Santa Fe Minerals 80%) |
| Issia | Mining exploration permit No. 880 | Cote D'Ivoire | 375 | |
| Tieningboue | Mining exploration permit application | Cote D'Ivoire | 104 |
________________________________
1 All figures in this announcement are unaudited. Amounts may not sum due to rounding.
2 Includes US$80M of restricted cash held in a liquidity reserve account and bullion of 22,444oz. All transactions costs associated with the merger were paid during the June 2026 quarter. Excluding bullion and restricted cash, net cash was US$194M (A$281M).
3 Cash includes US$80M of restricted cash held in a liquidity reserve account.
4 Guidance is based on current mine plans, operating assumptions, forecast cost inputs and management’s expectations as at the date of this report. Guidance remains subject to operational performance, market conditions and other factors that may impact production and costs.
5 All figures in this cash flow are unaudited. Amounts may not sum due to rounding. Cash margin from operations is defined as receipts from customers less payments for operating costs. Free cash flow (FCF) represents net cash flow from operating activities less capital expenditure. Excluding restricted cash, net cash was US$194M (A$281M).
Appendix 5B
Mining exploration entity or oil and gas exploration entity
quarterly cash flow report
| Name of entity | ||
| Predictive Discovery Ltd | ||
| ABN | Quarter ended (“current quarter”) | |
| 11 127 171 877 | 30 June 2026 | |
| Consolidated statement of cash flows |
Current quarter $A’000 |
Year to date (12 months) $A’000 |
|||
| 1. | Cash flows from operating activities | 285,811 |
285,811 |
||
| 1.1 | Receipts from customers | ||||
| 1.2 | Payments for | ||||
| (a) exploration & evaluation | |||||
| (b) development | |||||
| (c) production | |||||
| (d) staff costs | |||||
| (e) administration and corporate costs1. | |||||
| 1.3 | Dividends received (see note 3) | ||||
| 1.4 | Interest received | 2,132 | 3,789 | ||
| 1.5 | Interest and other costs of finance paid | ||||
| 1.6 | Income taxes paid | ||||
| 1.7 | Government grants and tax incentives | ||||
| 1.8 | Payments to suppliers and employees2. | (209,051 | ) | (220,407 | ) |
| 1.9 |
Net cash from / (used in) operating activities 1. Costs in prior quarters reallocated to 1.8 Payment to suppliers and employees. 2. Section 1.8 renamed “Payment to suppliers and employees” previously named “Other (BAS Refund)” |
78,892 | 69,193 | ||
| 2. | Cash flows from investing activities | ||||
| 2.1 | Payments to acquire or for: | ||||
| (a) entities | |||||
| (b) tenements | |||||
| (c) property, plant and equipment | (29,820 | ) | (43,722 | ) | |
| (d) exploration & evaluation 1. | (5,728 | ) | (19,175 | ) | |
| (e) investments | |||||
| (f) other non-current assets | |||||
| 2.2 | Proceeds from the disposal of: | ||||
| (a) entities | |||||
| (b) tenements | |||||
| (c) property, plant and equipment | |||||
| (d) investments | |||||
| (e) other non-current assets | |||||
| 2.3 | Cash flows from loans to other entities | ||||
| 2.4 | Dividends received (see note 3) | ||||
| 2.5 | Cash received in merger with Robex Resources Inc.2. | 220,212 | 220,212 | ||
| 2.6 |
Net cash from / (used in) investing activities 1. 2.1(d) includes costs associated with exploration fuel stock reallocated from section 2.5. 2. Section 2.5 renamed “Cash received in merger with Robex Resources Inc” from “Other (Fuel stock)” |
184,664 | 157,315 | ||
| 3. | Cash flows from financing activities | ||||
| 3.1 | Proceeds from issues of equity securities (excluding convertible debt securities) | ||||
| 3.2 | Proceeds from issue of convertible debt securities | ||||
| 3.3 | Proceeds from exercise of options | 1,095 | 1,145 | ||
| 3.4 | Transaction costs related to issues of equity securities or convertible debt securities | (47 | ) | ||
| 3.5 | Proceeds from borrowings | ||||
| 3.6 | Repayment of borrowings | ||||
| 3.7 | Transaction costs related to loans and borrowings | (181 | ) | (181 | ) |
| 3.8 | Dividends paid | ||||
| 3.9 | Interest paid on borrowings | (24,560 | ) | (24,560 | ) |
| 3.10 | Net cash from / (used in) financing activities | (23,646 | ) | (23,643 | ) |
| 4. | Net increase / (decrease) in cash and cash equivalents for the period | ||||
| 4.1 | Cash and cash equivalents at beginning of period | 32,534 | 69,230 | ||
| 4.2 | Net cash from / (used in) operating activities (item 1.9 above) | 78,892 | 69,193 | ||
| 4.3 | Net cash from / (used in) investing activities (item 2.6 above) | 184,664 | 157,315 | ||
| 4.4 | Net cash from / (used in) financing activities (item 3.10 above) | (23,646 | ) | (23,643 | ) |
| 4.5 | Effect of movement in exchange rates on cash held | 8,295 | 8,644 | ||
| 4.6 | Cash and cash equivalents at end of period | 280,739 | 280,739 | ||
| 5. |
Reconciliation of cash and cash equivalents at the end of the quarter (as shown in the consolidated statement of cash flows) to the related items in the accounts |
Current quarter $A’000 |
Previous quarter $A’000 |
| 5.1 | Bank balances | 280,305 | 32,479 |
| 5.2 | Call deposits | 434 | 55 |
| 5.3 | Bank overdrafts | - | - |
| 5.4 | Other | - | - |
| 5.5 | Cash and cash equivalents at end of quarter (should equal item 4.6 above) | 280,739 | 32,534 |
| Note: At 30 June 2026, the Group held restricted cash of A$117 million which is not included in cash and cash equivalents reported in Items 4.6 and 5.5. Total cash including restricted cash was A$399 million | |||
| 6. | Payments to related parties of the entity and their associates |
Current quarter $A'000 |
| 6.1 | Aggregate amount of payments to related parties and their associates included in item 1 | 1,486 |
| 6.2 | Aggregate amount of payments to related parties and their associates included in item 2 | - |
| Note: if any amounts are shown in items 6.1 or 6.2, your quarterly activity report must include a description of, and an explanation for, such payments. (Director fees for $283k (incl 14k GST) and termination payments for directors of $1,203k) | ||
| 7. |
Financing facilities Note: the term “facility’ includes all forms of financing arrangements available to the entity. Add notes as necessary for an understanding of the sources of finance available to the entity. |
Total facility amount at quarter end $A’000 |
Amount drawn at quarter end $A’000 |
| 7.1 | Loan facilities | 188,890 | 188,890 |
| 7.2 | Credit standby arrangements | - | - |
| 7.3 | Other (please specify) | - | - |
| 7.4 | Total financing facilities | ||
| 7.5 | Unused financing facilities available at quarter end | - | |
| 7.6 |
Include in the box below a description of each facility above, including the lender, interest rate, maturity date and whether it is secured or unsecured. If any additional financing facilities have been entered into or are proposed to be entered into after quarter end, include a note providing details of those facilities as well. | ||
|
Lender: Sprott Private Resource Lending III, Interest Rate: SOFR + 6.5%, Maturity: 31 March 2030, Fully Secured. | |||
| 8. | Estimated cash available for future operating activities | $A’000 | |
| 8.1 | Net cash from / (used in) operating activities (item 1.9) | 78,892 | |
| 8.2 | (Payments for exploration & evaluation classified as investing activities) (item 2.1(d)) | (5,728 | ) |
| 8.3 | Total relevant outgoings (item 8.1 + item 8.2) | 73,164 | |
| 8.4 | Cash and cash equivalents at quarter end (item 4.6) | 280,739 | |
| 8.5 | Unused finance facilities available at quarter end (item 7.5) | - | |
| 8.6 | Total available funding (item 8.4 + item 8.5) | 280,739 | |
| 8.7 |
Estimated quarters of funding available (item 8.6 divided by item 8.3) | N/A | |
| Note: if the entity has reported positive relevant outgoings (ie a net cash inflow) in item 8.3, answer item 8.7 as “N/A”. Otherwise, a figure for the estimated quarters of funding available must be included in item 8.7. | |||
| 8.8 | If item 8.7 is less than 2 quarters, please provide answers to the following questions: | ||
| 8.8.1 Does the entity expect that it will continue to have the current level of net operating cash flows for the time being and, if not, why not? | |||
| Answer: N/A |
|||
| 8.8.2 Has the entity taken any steps, or does it propose to take any steps, to raise further cash to fund its operations and, if so, what are those steps and how likely does it believe that they will be successful? | |||
| Answer: N/A |
|||
| 8.8.3 Does the entity expect to be able to continue its operations and to meet its business objectives and, if so, on what basis? | |||
| Answer: N/A |
|||
| Note: where item 8.7 is less than 2 quarters, all of questions 8.8.1, 8.8.2 and 8.8.3 above must be answered. | |||
Compliance statement
1 This statement has been prepared in accordance with accounting standards and policies which comply with Listing Rule 19.11A.
2 This statement gives a true and fair view of the matters disclosed.
Date: 30th July 2026
Authorised by: The Board
(Name of body or officer authorising release – see note 4)
Notes
- This quarterly cash flow report and the accompanying activity report provide a basis for informing the market about the entity’s activities for the past quarter, how they have been financed and the effect this has had on its cash position. An entity that wishes to disclose additional information over and above the minimum required under the Listing Rules is encouraged to do so.
- If this quarterly cash flow report has been prepared in accordance with Australian Accounting Standards, the definitions in, and provisions of, AASB 6: Exploration for and Evaluation of Mineral Resources and AASB 107: Statement of Cash Flows apply to this report. If this quarterly cash flow report has been prepared in accordance with other accounting standards agreed by ASX pursuant to Listing Rule 19.11A, the corresponding equivalent standards apply to this report.
- Dividends received may be classified either as cash flows from operating activities or cash flows from investing activities, depending on the accounting policy of the entity.
- If this report has been authorised for release to the market by your board of directors, you can insert here: “By the board”. If it has been authorised for release to the market by a committee of your board of directors, you can insert here: “By the [name of board committee – eg Audit and Risk Committee]”. If it has been authorised for release to the market by a disclosure committee, you can insert here: “By the Disclosure Committee”.
- If this report has been authorised for release to the market by your board of directors and you wish to hold yourself out as complying with recommendation 4.2 of the ASX Corporate Governance Council’s Corporate Governance Principles and Recommendations, the board should have received a declaration from its CEO and CFO that, in their opinion, the financial records of the entity have been properly maintained, that this report complies with the appropriate accounting standards and gives a true and fair view of the cash flows of the entity, and that their opinion has been formed on the basis of a sound system of risk management and internal control which is operating effectively.
A figure accompanying this announcement is available at https://www.globenewswire.com/NewsRoom/AttachmentNg/c1ac495c-a4a0-4d04-92c1-63b0c7ec4b7b


Figure 1
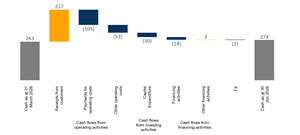
Quarterly Cash Flow Waterfall (US$M)
Legal Disclaimer:
EIN Presswire provides this news content "as is" without warranty of any kind. We do not accept any responsibility or liability for the accuracy, content, images, videos, licenses, completeness, legality, or reliability of the information contained in this article. If you have any complaints or copyright issues related to this article, kindly contact the author above.
